Welcome to Code Forum!

Join a community that supports you and your coding journey from day one. We strive to be a friendly, supportive community that empowers everyone to be better developers. By registering with us, you'll be able to discuss, share and private message with other members of our community.

SignUp Now!
  • Guest, before posting your code please take these rules into consideration:
    • It is required to use our BBCode feature to display your code. While within the editor click < / > or >_ and place your code within the BB Code prompt. This helps others with finding a solution by making it easier to read and easier to copy.
    • You can also use markdown to share your code. When using markdown your code will be automatically converted to BBCode. For help with markdown check out the markdown guide.
    • Don't share a wall of code. All we want is the problem area, the code related to your issue.

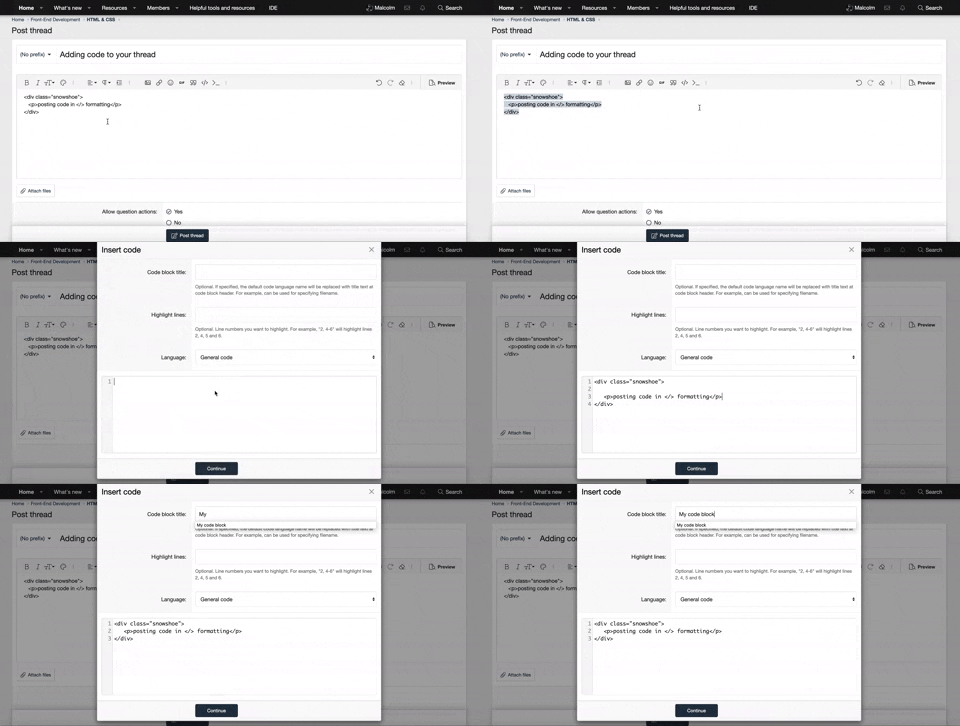
    GIF shows where to locate </> in the thread and or post editor toolbar.
    To learn more about how to use our BBCode feature, review our "How to post your code into threads" here.

    Thank you, Code Forum.

Java Google Gauges Charts

maudit

New Coder
Hi,
I need a small help in order to understand how to modify the code below, that come from here:
The result should be a static image, with no animation at all, that contains 2,3 or 4 gauges, each one with different values, scales, colors, everything.
Thx.


JavaScript:
<html>
  <head>
   <script type="text/javascript" src="https://www.gstatic.com/charts/loader.js"></script>
   <script type="text/javascript">
      google.charts.load('current', {'packages':['gauge']});
      google.charts.setOnLoadCallback(drawChart);

      function drawChart() {

        var data = google.visualization.arrayToDataTable([
          ['Label', 'Value'],
          ['Memory', 80],
          ['CPU', 55],
          ['Network', 68]
        ]);

        var options = {
          width: 400, height: 120,
          redFrom: 90, redTo: 100,
          yellowFrom:75, yellowTo: 90,
          minorTicks: 5
        };

        var chart = new google.visualization.Gauge(document.getElementById('chart_div'));

        chart.draw(data, options);

        setInterval(function() {
          data.setValue(0, 1, 40 + Math.round(60 * Math.random()));
          chart.draw(data, options);
        }, 13000);
        setInterval(function() {
          data.setValue(1, 1, 40 + Math.round(60 * Math.random()));
          chart.draw(data, options);
        }, 5000);
        setInterval(function() {
          data.setValue(2, 1, 60 + Math.round(20 * Math.random()));
          chart.draw(data, options);
        }, 26000);
      }
    </script>
  </head>
  <body>
    <div id="chart_div" style="width: 400px; height: 120px;"></div>
  </body>
</html>

 
my latest unsucessful attempt


Code:
<html>
  <head>
   <script type="text/javascript" src="https://www.gstatic.com/charts/loader.js"></script>
   <script type="text/javascript">
      google.charts.load('current', {'packages':['gauge']});
      google.charts.setOnLoadCallback(drawChart);

      function drawChart() {

        var data = google.visualization.arrayToDataTable([
          ['Label', 'Value'],
          ['Avg QP', 20],
          ['Ratio', 60],
          ['Remux', 25],
          ['Speed', 2],         
        ]);

        var options1 = {
          width: 800, height: 200,
              min: 15, max: 26,
          redFrom: 25, redTo: 26,
          yellowFrom:23, yellowTo: 25,
              greenFrom:16, greenTo: 23,
          minorTicks: 5, majorTicks: ['15','16','17','18','19','20','21','22','23','24','25','26']
        };
        
        var options2 = {
          width: 800, height: 200,
              min: 0, max: 100,
          redFrom: 90, redTo: 100,
          yellowFrom:80, yellowTo: 90,
              greenFrom:20, greenTo: 80,
          minorTicks: 5, majorTicks: ['0','10','20','30','40','50','60','70','80','90','100']
        };
        
        var options3 = {
          width: 800, height: 200,
              min: 5, max: 35,
          redFrom: 30, redTo: 35,
          yellowFrom:25, yellowTo: 30,
              greenFrom:10, greenTo: 25,
          minorTicks: 5, majorTicks: ['5','10','15','20','25','30','35']
        };
        
        var options4 = {
          width: 800, height: 200,
              min: 0, max: 10,
          redFrom: 0, redTo: 2,
          yellowFrom:2, yellowTo: 3,
              greenFrom:3, greenTo: 10,
          minorTicks: 5, majorTicks: ['0','1','2','3','4','5','6','7','8','9','10']
        };

        var chart1 = new google.visualization.Gauge(document.getElementById('chart_div'));
        var chart2 = new google.visualization.Gauge(document.getElementById('chart_div'));
        var chart3 = new google.visualization.Gauge(document.getElementById('chart_div'));
        var chart4 = new google.visualization.Gauge(document.getElementById('chart_div'));

        chart1.draw(data, options1);
        chart2.draw(data, options2);
        chart3.draw(data, options3);
        chart4.draw(data, options4);
        
      }
    </script>
  </head>
  <body>
    <div id="chart_div" style="width: 800px; height: 2000px;"></div>
  </body>
</html>
 

Buy us a coffee!

Buy me a coffee.
Back
Top Bottom