ratwolf
Bronze Coder
Dor:
"Time, he learned, was not to be measured in hours or minutes, or even seconds. Time was measured in moments. The time keeper didn’t just count the seconds, he understood their significance, how each moment could shape a life, a destiny."
"the true beauty of time lies in its impermanence"
Albom, Mitch. The Time Keeper. New York: Hyperion, 2012.
Python:
import numpy as np
import matplotlib.pyplot as plt

def generate_wave(custom_function, samples=100, x_range=(-1, 1)):
    """
    Generate a wave based on a user-defined function.

    Args:
        custom_function (callable): A function to generate the wave. Takes an array of x values as input.
        samples (int): Number of points to generate.
        x_range (tuple): Range of x values (start, end).

    Returns:
        np.ndarray: Generated wave values.
    """
    x = np.linspace(x_range[0], x_range[1], samples)  # Generate x values
    y = custom_function(x)  # Apply the custom function
    return y

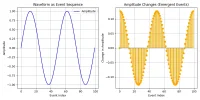
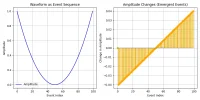
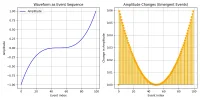
def plot_wave_as_events(wave_data):
    """
    Plot a waveform using event indices and show amplitude changes.

    Args:
        wave_data (np.ndarray): The wave values to plot.
    """
    event_indices = range(len(wave_data))  # Use sequential event indices
    amplitude_changes = np.diff(wave_data, prepend=wave_data[0])  # Capture changes

    plt.figure(figsize=(10, 5))

    # Plot original wave with event indices
    plt.subplot(1, 2, 1)
    plt.plot(event_indices, wave_data, label="Amplitude", color="blue")
    plt.title("Waveform as Event Sequence")
    plt.xlabel("Event Index")
    plt.ylabel("Amplitude")
    plt.grid(True)
    plt.legend()

    # Plot only state changes (emergent feature)
    plt.subplot(1, 2, 2)
    plt.stem(event_indices, amplitude_changes, linefmt="orange", markerfmt="o", basefmt="gray")
    plt.title("Amplitude Changes (Emergent Events)")
    plt.xlabel("Event Index")
    plt.ylabel("Change in Amplitude")
    plt.grid(True)

    plt.tight_layout()
    plt.show()

def main():
    """
    Main function to coordinate wave generation and plotting.
    """
    # Define user-selectable functions
    def sine_wave(x):
        return np.sin(2 * np.pi * x)

    def parabola(x):
        return x**2

    def cubic(x):
        return x**3

    def cosine_wave(x):
        return np.cos(2 * np.pi * x)

    def tangent_wave(x):
        return np.tan(2 * np.pi * x) / 10

    def exponential(x):
        return np.exp(x)

    def logarithmic(x):
        return np.log(x + 1.1)

    def square_wave(x):
        return np.sign(np.sin(2 * np.pi * x))

    def sawtooth_wave(x):
        return 2 * (x - np.floor(x + 0.5))

    def quartic(x):
        return x**4 - x**2

    def noisy_sine_wave(x):
        return np.sin(2 * np.pi * x) + 0.2 * np.random.randn(len(x))

    def hybrid_sin_exp(x):
        return np.sin(2 * np.pi * x) * np.exp(-x)

    def piecewise_function(x):
        return np.where(x < 0, x**2, np.sin(2 * np.pi * x))

    # Map choices to functions
    functions = {
        "1": ("Sine Wave", sine_wave),
        "2": ("Parabola", parabola),
        "3": ("Cubic", cubic),
        "4": ("Cosine Wave", cosine_wave),
        "5": ("Tangent Wave", tangent_wave),
        "6": ("Exponential", exponential),
        "7": ("Logarithmic", logarithmic),
        "8": ("Square Wave", square_wave),
        "9": ("Sawtooth Wave", sawtooth_wave),
        "10": ("Quartic", quartic),
        "11": ("Noisy Sine Wave", noisy_sine_wave),
        "12": ("Hybrid Sin-Exp", hybrid_sin_exp),
        "13": ("Piecewise Function", piecewise_function)
    }

    # Display options to the user
    print("Choose a function to experiment:")
    for key, (name, _) in functions.items():
        print(f"{key}: {name}")

    # Get user input
    choice = input("Enter your choice (1-13): ").strip()
    chosen_function = functions.get(choice, ("Sine Wave", sine_wave))[1]

    # Generate and plot the wave
    wave = generate_wave(custom_function=chosen_function, samples=100, x_range=(-1, 1))
    plot_wave_as_events(wave)

if __name__ == "__main__":
    main()
Last edited: