Hi,
I need help for a project, where states are to be mapped graphically, see the picture in the attachment. It is about the fact that when states and variables in javascript change, this should be displayed graphically.
Until now I have done it so that there is a picture for all possible states. The problem is, when the system expands, this gets more and more out of hand, as far as the creation of the respective states is concerned.
The image shows a simplified and minimalistic representation of how the process should be mapped.
My question is, are there easier or more elegant ways to animate this process image for html using js or css.
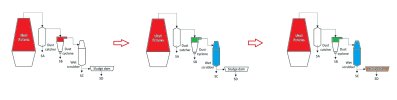
I need help for a project, where states are to be mapped graphically, see the picture in the attachment. It is about the fact that when states and variables in javascript change, this should be displayed graphically.
Until now I have done it so that there is a picture for all possible states. The problem is, when the system expands, this gets more and more out of hand, as far as the creation of the respective states is concerned.
The image shows a simplified and minimalistic representation of how the process should be mapped.
My question is, are there easier or more elegant ways to animate this process image for html using js or css.